Update 1.85 – Lighthouse & CrUX Data at Scale

The latest URL Profiler update contains a new and improved PageSpeed API integration, utilizing the very recently released Lighthouse data, which you can now see in Google PageSpeed Insights:

This is a departure from the old PageSpeed metrics, which were based on performance optimization rules – whereas these metrics are much more user-centric.
Lighthouse Data in Bulk
What this means for URL Profiler customers is that they can now query the PageSpeed API to collect Lighthouse data in bulk, which is pretty awesome.
You don’t need to do anything differently to how you’ve been doing it already, and you don’t even need a new API key. Just select either ‘Mobile PageSpeed’ or ‘Desktop PageSpeed’ and wait for the data to come in.

From the Lab Data, there are 6 core timing metrics:
- Lab Data – First Contentful Paint (s)
- Lab Data – First Meaningful Paint (s)
- Lab Data – Speed Index (s)
- Lab Data – First CPU Idle (s)
- Lab Data – Time to Interactive (s)
- Lab Data – Estimated Input Latency (ms)
If you’re already a Lighthouse fan you will probably know all or most of these already. If they are all new to you, click on the links above to read up on what each one means.
The TL;DR is that they are metrics based on how long it takes for the user to feel like the page has loaded.
Page Level CrUX Data – at Scale
I’ve kind of buried the lede here, as possibly the most exciting change is the opportunity to collect Chrome User Experience (CrUX) data on a page by page basis – for hundreds or thousands of pages at a time. If you’re wondering how CrUX data is different to the page timings data we looked at above, I’ll let Google explain:

So this is actual user data, collected from Chrome, measuring the actual timings of real website visitors. See the FAQs below to get a better understanding as to how and why this is different from the lab data.
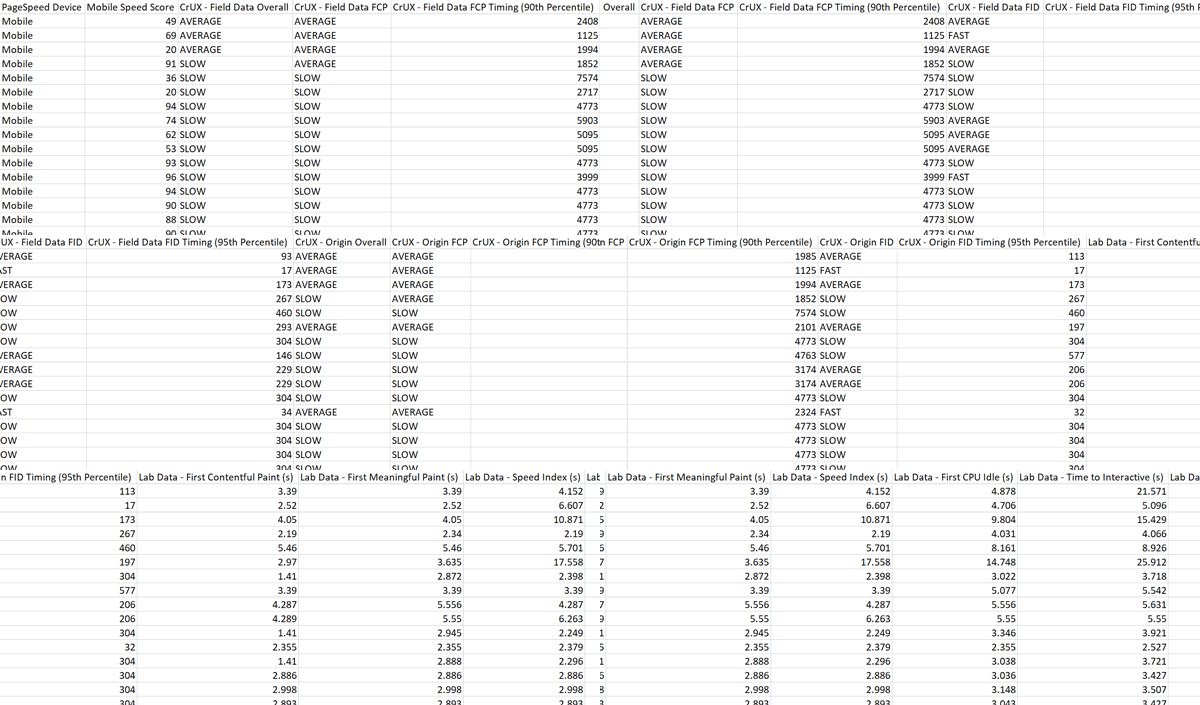
For now, we’ll take a look at the data you can get back from URL Profiler. I’ve transposed the columns to make it easier to read as a static image:

I’ve highlighted some of the cells as I think of these as the most important bit. Ok it is nice to know that the First Contentful Paint (FCP) timing is 2408ms (=2.4 seconds), but it is much more useful to know that this is only average, rather than FAST as we would like (assuming this is your site).
The Origin Data relates to an aggregate across the whole domain (origin), for all URLs on the domain that they have CrUX data for.
And this brings us onto a very important caveat: not all URLs are included in the Chrome User Experience Report.
In fact, based on some of the tests we’ve been doing, about only 1 in 6 URLs have any CrUX data.
So if you enter some URLs which they don’t have sufficient data for, you will see this message: “No CrUX Data Available”. This doesn’t mean it’s broken or anything is wrong, it just means that they haven’t been able to collect enough field data from Chrome users for that particular URL. If you scroll right you will still see all the awesome Lighthouse metrics though, based on the ‘lab test.’
You also may find that they have desktop data but not mobile, and vice versa.
PageSpeed Insights FAQs
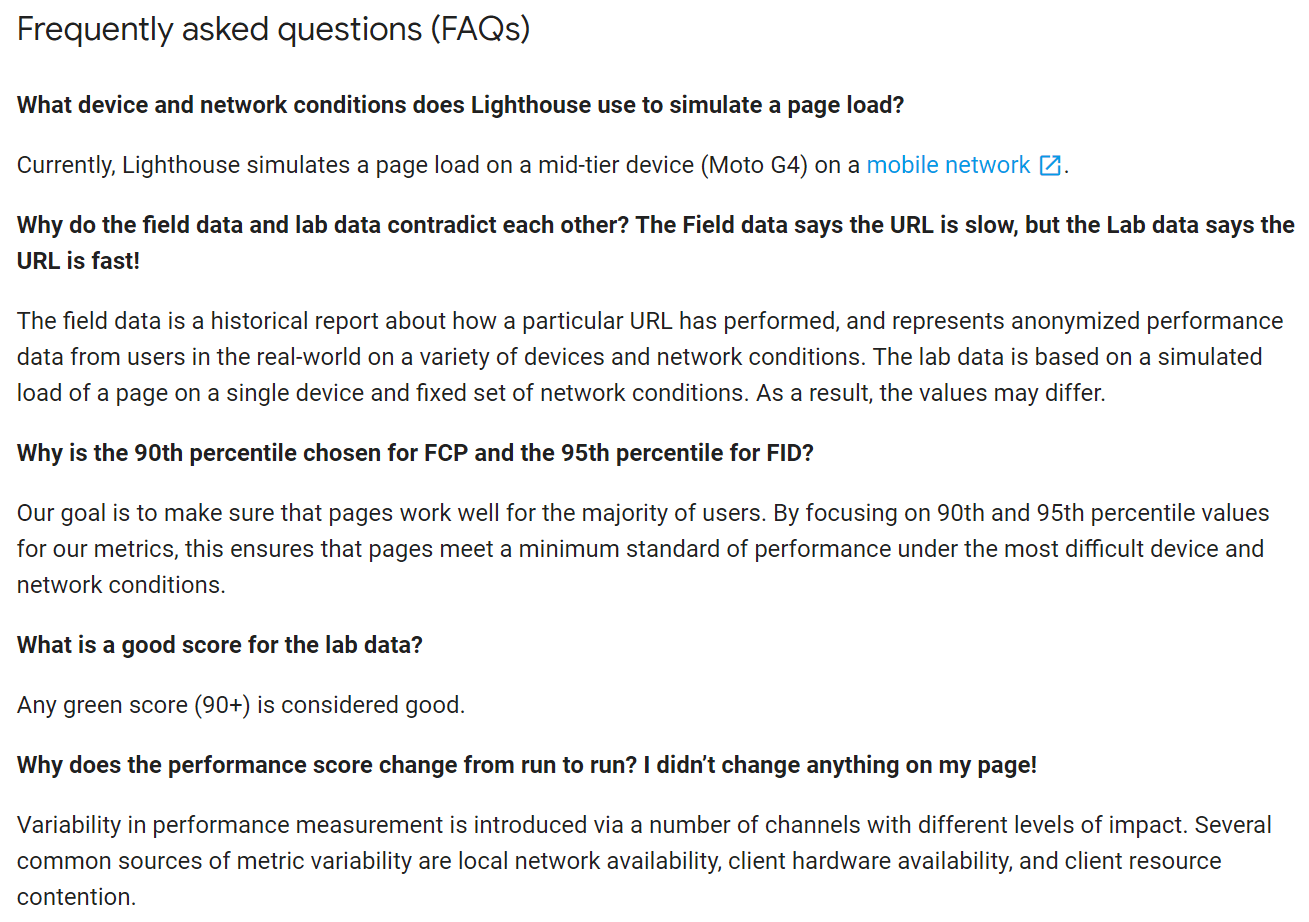
This stuff is all pretty new to a lot of people, and at essence it is a different way to think about page speed. In our opinion it is the right way, considering the actual user experience vs all potential performance optimizations you could do.
But since it’s so new, folks probably have a lot of questions about it. And since I am massively lazy, I am just going to copy and paste the FAQ that Google already published:

Downloads
Existing customers or existing trial users can grab the new update from here:
If you’ve not tried URL Profiler yet, you can start a free 14 day trial here. The trial is fully featured, and you don’t need to give us any payment details to get started.
