How To Build a Content Inventory

For the purpose of this post, we will assume that you are sold on the benefits of performing a content audit on your website, or your client sites.
If that is not the case and you need some convincing, I suggest you check out this webinar from Everett Sizemore (we helped out in the Q & A).
The first stage of an audit of this kind is building out the content inventory. This will be the master set of data which you will anaylse to help figure out how your site is performing. Fortunately, URL Profiler can help you out with most of it.
What Is a Content Inventory?
It is worth us defining what we mean by a content inventory in the first place:
“A content inventory is a complete listing of every page on your website, with associated meta information and metrics, which allows you to make both general and specific evaluations of your website content.”
In our definition, the inventory will allow for quantitative and qualitative analysis.
Note: There is a significant difference between a content inventory and a content audit. Where a content inventory is a listing of all your content, a content audit is an evaluation of this content.
Getting Set Up
The problem with building a content inventory is that you typically wish to combine several distinct sets of data. You’d have to pull together data from Screaming Frog, Google Analytics, Moz, Majestic, SEMRush, etc… with 400 different VLOOKUPs into Excel.
Not nice.
Fortunately for you, the fabulous folk over at URL Profiler (oh wait that’s us) have built a tool that pulls all this together. It’s called… URL Profiler.
Ok ok I’ll get on with it.
To get started, you need to import your URLs. The quickest way to do that is to right click on the white URL List box, and select ‘Import from XML Sitemap’. However if you just have a list of links you can paste these in, or alternatively you can directly import your Screaming Frog export file (more info on this here).
So if we were building an inventory for this site, we could import from our XML sitemap (https://172-233-222-199.ip.linodeusercontent.com/sitemap_index.xml).
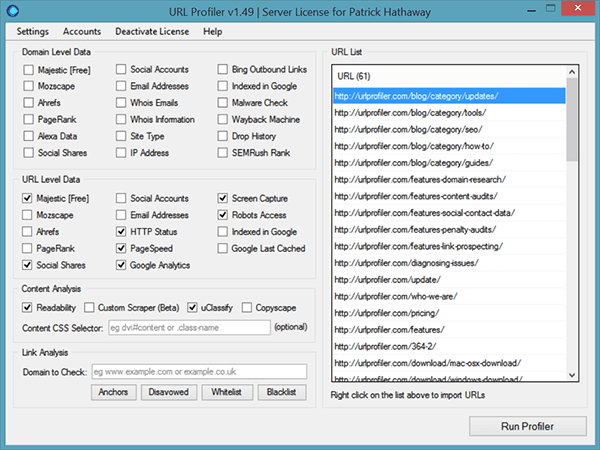
Then we just need to select the data points we want URL Profiler to collect. This is what my typical settings look like for building a content inventory:
I’ll explain what each of these will give you, and what you can do with the data. It is important to note that you don’t need to pay for any additional services in order to run this inventory.
Majestic (Free)
This will tell you which pages have the most link equity and have performed best in terms of attracting incoming links.
The data returned, for each specific URL, is as follows:
- Citation Flow
- Trust Flow
- External Backlinks (pointing at the URL)
- Referring Domains (pointing at the URL)
If you want this data faster, you can add your paid Majestic API credentials – here is a guide on how to do that. Similarly, if you prefer Moz metrics or Ahrefs data you can add those instead.
Social Shares
This is really useful if you have content primed for sharing (perhaps less useful for ecommerce…), as you can quickly determine which topics get the most social traction.
The specific data returned is determined by which social networks you choose from the setting panel, the options include Google+, Twitter, Facebook, LinkedIn and Pinterest.
HTTP Status
The HTTP status will tell you if any of your pages return a 404 or 301 (or indeed any other status code), which is very useful for cleaning up your site.
If the URL does follow a redirect, you will also get the status code and status for the resolution URL.
PageSpeed
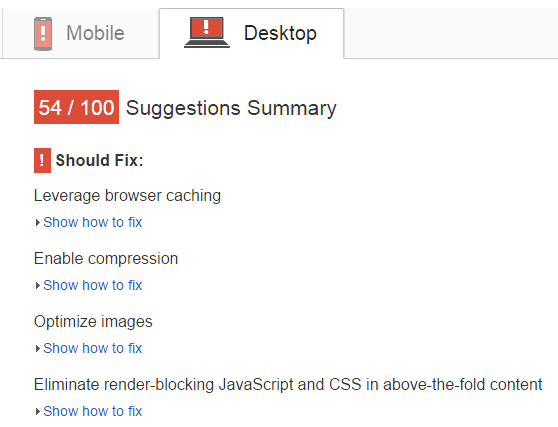
Using the popular Google PageSpeed API, you can find out if your site speed can be improved. Rather than simply giving you a PageSpeed score for a single URL (as you use it in the browser), URL Profiler will allow you to judge PageSpeed for each individual URL.
This can be very insightful if you look at URLs by directory (or URL path) – which will allow you to figure out if certain page types are significantly slower than others.
The data returned gives you the PageSpeed score (out of 100) as well as the specific custom URL with all your improvement suggestions:
In order to use the PageSpeed option you’ll need to enter a (free) Google PageSpeed API – here is a guide on how to do this.
Google Analytics Data
This allows you to pull in usage data right alongside all the quantitative and qualitative measures we are looking at. The ability to pull in specific segment data (e.g. ‘Search Traffic’) makes this even more useful still.
Here are a few things you can do with the Google Analytics data:
- Which pages, or page types, have a particularly high (or low) time on page?
- Which pages, or page types, have a particularly high bounce rate?
- Which pages generate the most exists? Does this match your expectations?
Connecting to Google Analytics is very straightforward – here is a guide on how to do it.
Screen Capture
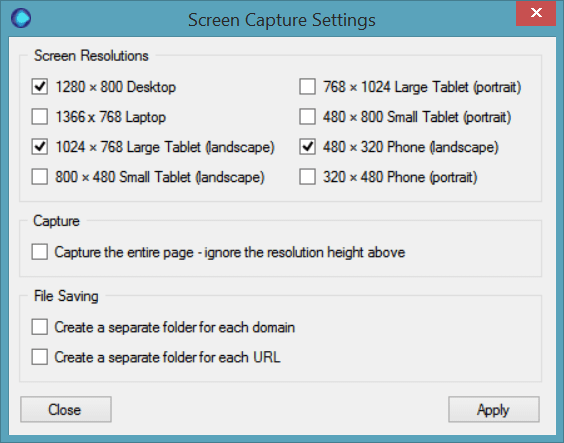
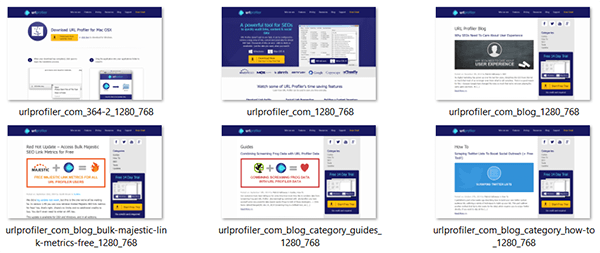
This gives you an in-browser screenshot of every URL you enter, allowing you to keep a visual record of what you content looks like. This is output in a separate folder, and can be customised to display a variety of resolutions for desktop, laptop, tablet and phone displays.
This is very useful if you want to quickly check that your pages aren’t falling over, or confirm how they display on tablet/mobile. Depending on which Operating System you are running, you can quickly view theses screen captures in preview mode to get a visual feel for the content.
Robots Access
Checks to see if each URL is disallowed via robots.txt, and reports back on any robots meta data and X-Robots-Tags associated with the URL. It also returns the URL defined by rel=”canonical” and the HTTP header (if found).
This is particularly useful for debugging indexation issues (i.e. this URL should/shouldn’t be indexed)
Readability
This option gives you an abundance of data about the actual textual content on each page. This allows you to slice and dice your data in all sorts of ways, to help you spot patterns and trends in the data.
An enormous amount of data is returned, including:
- Text length, HTML length and Text to HTML ratio
- Title, Description and associated character counts
- Word count, paragraph count, sentence count and header count
- Reading time
- Top 5 most frequently used words on the page (to give you a rough idea of ‘topic’)
- Sentiment (Positive, negative, neutral)
- Reading levels and scores
- External and internal link counts
Clearly this type of data takes a bit more examination to analyse, but potentially unlocks the key to some of your most important findings. Do positive posts get more shares on social media? Do longer posts tend to attract more links?
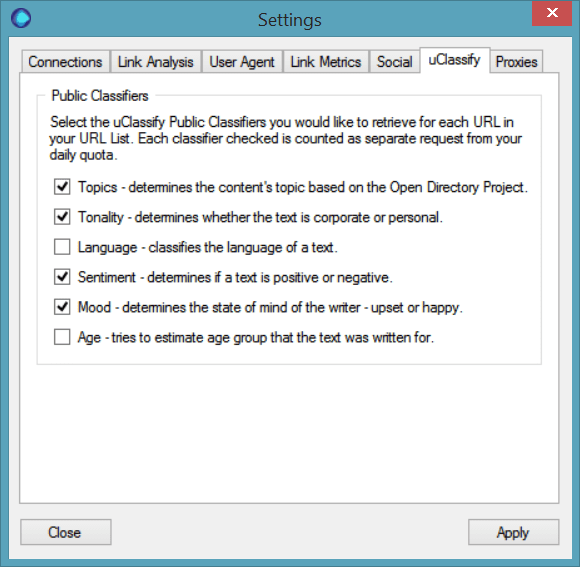
uClassify
uClassify is a text analyser service which gives you further analytical data about your page content, depending on the options you select from the settings menu.
uClassify has a free API which gives you 5000 credits (guide to set-up here), and the various options will give you a lot more context about the type of content on your site.
Next Steps
Getting the data is typically the most laborious part of this process, however as you can see URL Profiler makes it mindlessly easy to do.
I’ll be following up soon with a blog post that shows you how to analyse this data, but it’s likely you have a fair idea already of the type of data you are interested in.
Some of the questions I like to answer during a content audit include:
- Do I have any poor quality pages that no one is visiting?
- Do I have pages that lots of people visit but no one shares or engages with?
- How are the links spread across my site?
- Are there any obvious errors I need to fix?
- Are there any patterns or commonalities that can help me determine which type of content to produce in the future?
One way to handle this is to go through each page and determine if you want to Keep, Improve or Remove it. For further reading on this topic, I’d suggest you consult Everett’s Moz post (the one that inspired the webinar) entitled ‘How To Do a Content Audit – Step-by-Step.’


